
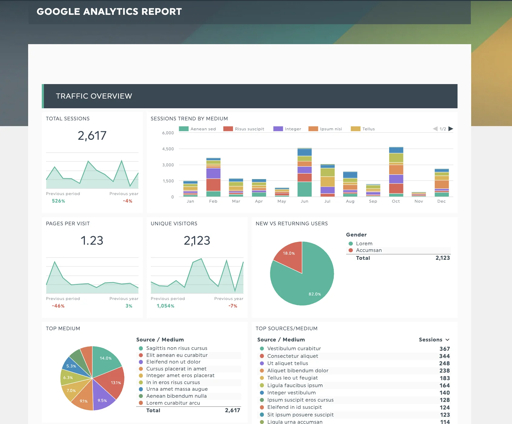
Data visualisation should help a particular audience understand information and take appropriate action. Cambridge providers offer different strengths in interface design, explanatory graphics, scientific analysis and data platforms. These five publish relevant services and Cambridge connections. Their numbering is not a ranking of design quality or analytical accuracy. Confirm whether the work includes analysis, visual design, implementation or a combination, because an effective presentation depends on more than the appearance of a chart.
1. JDJ Creative
JDJ publishes Cambridge-based visualisation services involving dashboards, interfaces, design systems and explanatory visual content. Its description distinguishes the visual-design contribution from the data analysis clients may supply. A business with established findings can ask how they should be communicated. Confirm who validates the underlying information and who implements interactive work. A compelling visual should not be treated as proof of the analysis, and a design engagement should not silently inherit responsibility for every source record.
Published provider information: JDJ Creative
2. Bullaki
Bullaki publishes Cambridge data-visualisation services for presenting large amounts of information creatively through platforms and scientific or communication work. An organisation with complex material can enquire about audience and format. Ask whether the proposal covers interpretation, story development, static graphics or interactive output. Confirm the actual team and evidence requirements. A visual treatment should explain its purpose and limitations rather than make information seem more certain or comprehensive than the underlying analysis supports.
Published provider information: Bullaki
3. Akendi UK
Akendi publishes Cambridge and London data-visualisation design aimed at supporting decisions rather than applying standard templates. A business planning a dashboard or information interface can ask how users and tasks will inform the design. Request the research, prototyping and implementation boundaries separately. A usable interface is not automatically an independently verified analysis; agree who checks definitions, calculations and source information before the visuals are treated as a basis for operational decisions.
Published provider information: Akendi UK
4. Cambridge Biostatistics Consultancy
Cambridge Biostatistics Consultancy is based in the University of Cambridge’s MRC Biostatistics Unit and explicitly serves industry, public and charitable clients. Its described work includes study design, analysis and visualisation. It is a specialist statistical option, not a general branding agency. A relevant organisation can ask about the fit, access and commissioning requirements. Confirm the research question and scope rather than assume every commercial dashboard or marketing graphic falls within the consultancy’s remit.
Published provider information: Cambridge Biostatistics Consultancy
5. Softwire
Softwire publishes a Cambridge office and data-platform, modelling and strategy services. A business whose visual reporting depends on fragmented systems can ask about the engineering foundations as well as the output. This is a broader data-and-software option rather than solely a graphic-design practice. Request the actual visualisation scope and relevant examples. Confirm responsibility for source pipelines, calculations, access and refreshes so a polished interface does not depend on an undocumented or unreliable process.
Published provider information: Softwire
How to compare the proposed options
Identify the audience, decision and information to be communicated. Ask what is known, what is estimated and which limitations must remain visible. Separate data preparation, analysis, visual design and technical implementation when comparing proposals. Agree definitions and review the intended use rather than choose a format only because it looks impressive in a portfolio.
Confirm accessibility, interaction, devices and export requirements. Request ownership of designs, code, source files and documentation. Ask who maintains the output when information changes and who approves analytical corrections. A chart can make a pattern easier to see without proving its cause or generality, so review the underlying evidence as well as the presentation. Arrange appropriate confidentiality and data-handling responsibilities before sharing sensitive records.
Additional links supplied for this article
All four supplied links are included below. Innovate Signals and Script Refined were accessible as general technology-related publications during this check. Virtual Data Ops and Innovate Firewall could not be retrieved, so their contents were not verified. These links are not evidence for provider entries or professional credentials, and inclusion does not imply affiliation, endorsement or an assessment of technical accuracy.
FAQs
Does visualisation consultancy always include analysis?
No. Confirm the scope and who validates the information.
Are all five general design agencies?
No. The list distinguishes design, statistical and broader platform specialisms.
Must the result be an interactive dashboard?
Choose the format around the audience, task and maintenance needs.
Who updates it after delivery?
Agree refreshes, source changes, approvals and continuing ownership.
Make the next enquiry specific
Choose support around the audience and evidence, then compare analysis and presentation separately. Agree validation, ownership and maintenance before appointing. A useful visualisation should make both the information and its limits clearer rather than simply turn a dataset into an attractive image.